GRE Data Interpretation Practice
Data Interpretation questions test whether you can turn tables, charts, and short datasets into the exact quantity requested—without confusing visual scale with numerical evidence.
What Data Interpretation covers
Expect tables, bar and line charts, scatterplots, circle graphs, and numerical datasets. Skills include ratios, percent change, weighted averages, median, range, and basic probability.
- Read titles, axes, units, and legends
- Distinguish counts from percentages
- Use only the data the question needs
A disciplined DI method
Read the question before scanning the graphic. Translate it into an equation, pull the exact values with their units, estimate, then calculate. Use the estimate to catch misplaced decimals and reversed percent bases.
Common DI traps
Truncated axes can exaggerate differences. Percent change uses the original value as the denominator. Pie slices show shares of a total, not raw values unless the total is known.
From the GREKMF question bank
Real questions with Premium explanations
Question 1 · GREKMF #38
medium · mcq single
Show correct answer and full Premium explanation
Correct answer: E
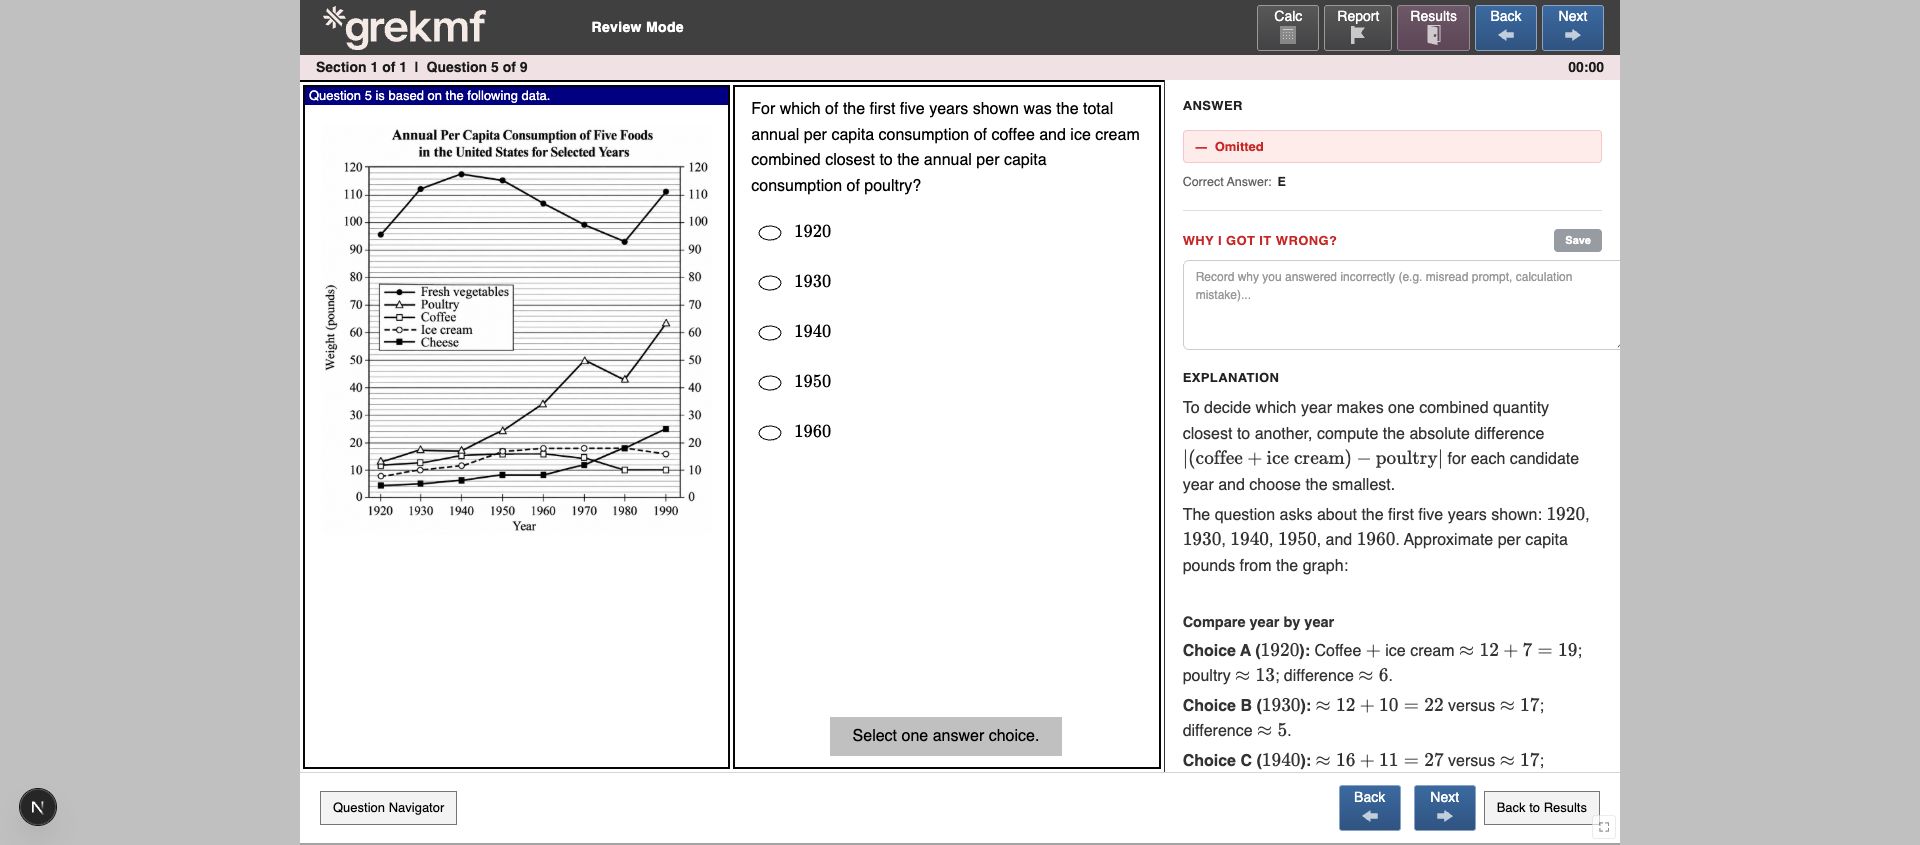
To decide which year makes one combined quantity closest to another, compute the absolute difference $\lvert (\text{coffee} + \text{ice cream}) - \text{poultry} \rvert$ for each candidate year and choose the smallest.
The question asks about the first five years shown: $1920$, $1930$, $1940$, $1950$, and $1960$. Approximate per capita pounds from the graph:
Compare year by year
Choice A ($1920$): Coffee $+$ ice cream $\approx 12 + 7 = 19$; poultry $\approx 13$; difference $\approx 6$.
Choice B ($1930$): $\approx 12 + 10 = 22$ versus $\approx 17$; difference $\approx 5$.
Choice C ($1940$): $\approx 16 + 11 = 27$ versus $\approx 17$; difference $\approx 10$.
Choice D ($1950$): $\approx 16 + 16 = 32$ versus $\approx 24$; difference $\approx 8$.
Choice E ($1960$): $\approx 16 + 18 = 34$ versus $\approx 34$; difference $\approx 0$.
The smallest difference is in $1960$.
Things to Remember:
- “Closest” means the smallest absolute difference.
- Add the two series first, then compare to the third.
- Graph-reading approximations are fine when the ranking of differences is clear.
Question 2 · GREKMF #43
medium · mcq multiple
Show correct answer and full Premium explanation
Correct answer: B, C
A percent decrease from an old value to a new value is $\dfrac{\text{old} - \text{new}}{\text{old}} \times 100\%$; a percent increase uses $\dfrac{\text{new} - \text{old}}{\text{old}} \times 100\%$. The arithmetic mean of three numbers is their sum divided by $3$. The standard deviation measures spread about the mean; among data sets of the same size, a larger spread from the center generally means a larger standard deviation.
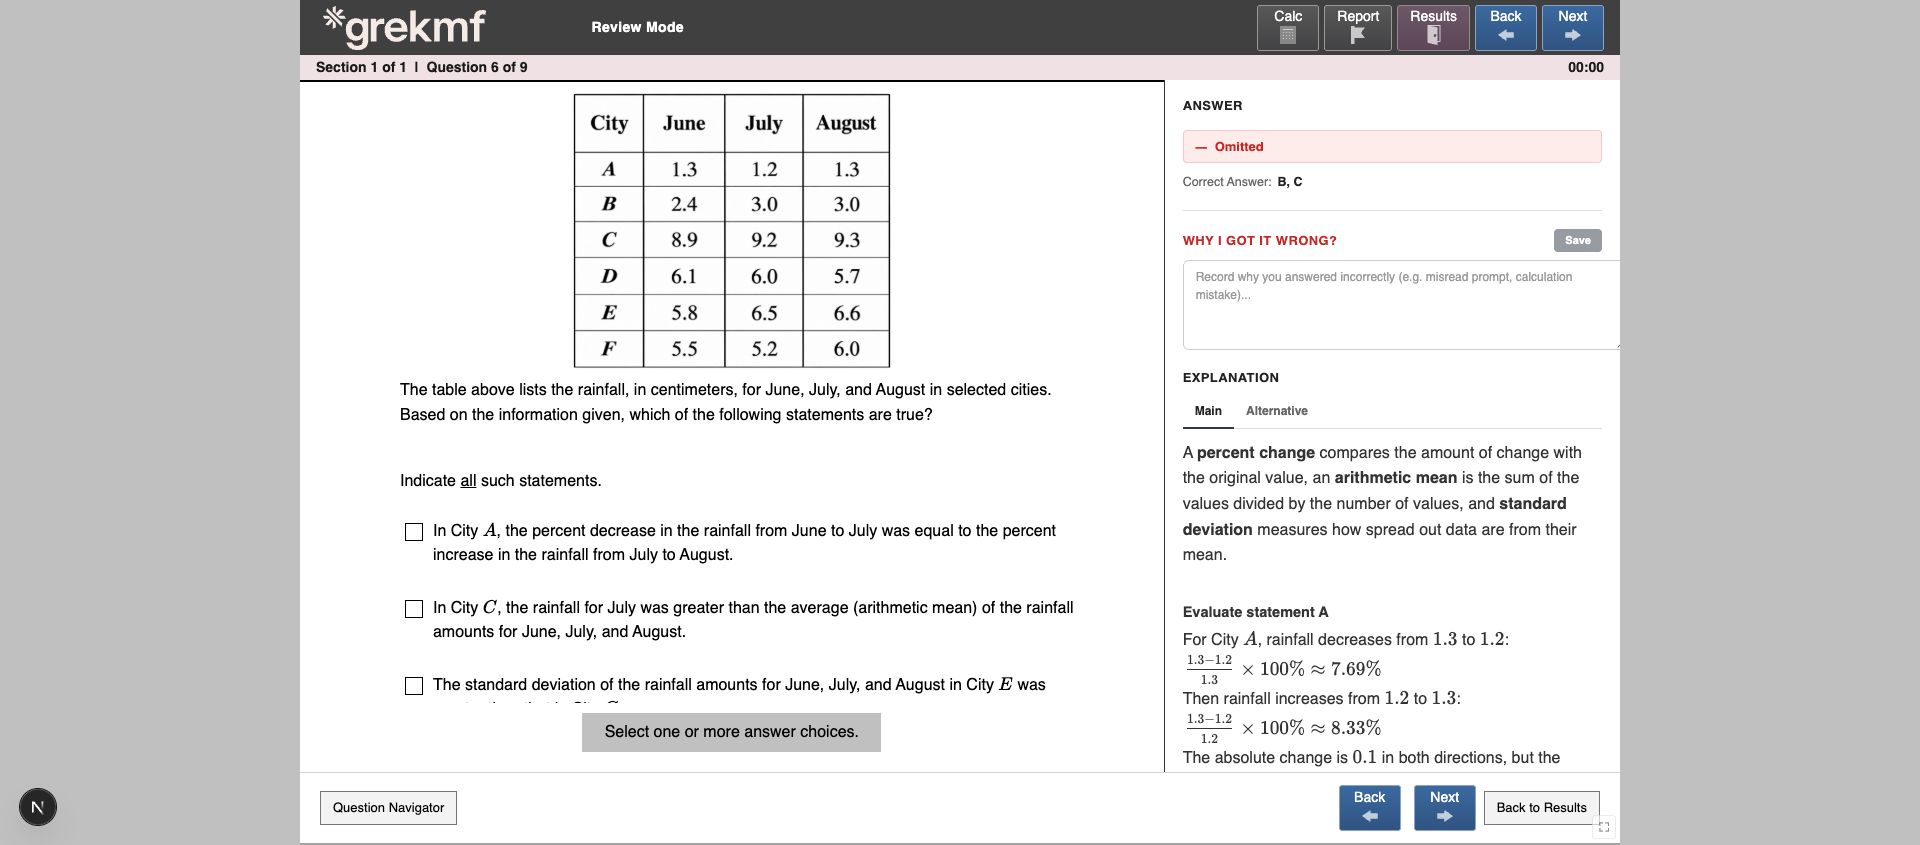
From the table, City A has rainfall $1.3$, $1.2$, $1.3$; City C has $8.9$, $9.2$, $9.3$; City E has $5.8$, $6.5$, $6.6$ (June, July, August).
Evaluate each statement
Choice A: In City A, percent decrease June to July $= \dfrac{0.1}{1.3} \times 100\% \approx 7.7\%$. Percent increase July to August $= \dfrac{0.1}{1.2} \times 100\% \approx 8.3\%$. These are not equal, so A is false. (Equal absolute changes from different bases are not equal percents.)
Choice B: City C mean $= \dfrac{8.9 + 9.2 + 9.3}{3} = \dfrac{27.4}{3} \approx 9.133$. July’s $9.2$ is greater than this mean, so B is true.
Choice C: City C’s values $8.9$, $9.2$, $9.3$ cluster tightly (range $0.4$). City E’s values $5.8$, $6.5$, $6.6$ spread farther from their mean (range $0.8$, with a larger gap from June to July). So the standard deviation for City E is greater than for City C, and C is true.
The true statements are B and C.
Things to Remember:
- Percent change always divides by the starting value of that interval.
- A value can exceed the mean of its set even when all values are close together.
- Greater spread about the mean implies a greater standard deviation.
Question 3 · GREKMF #119
medium · mcq single
Show correct answer and full Premium explanation
Correct answer: C
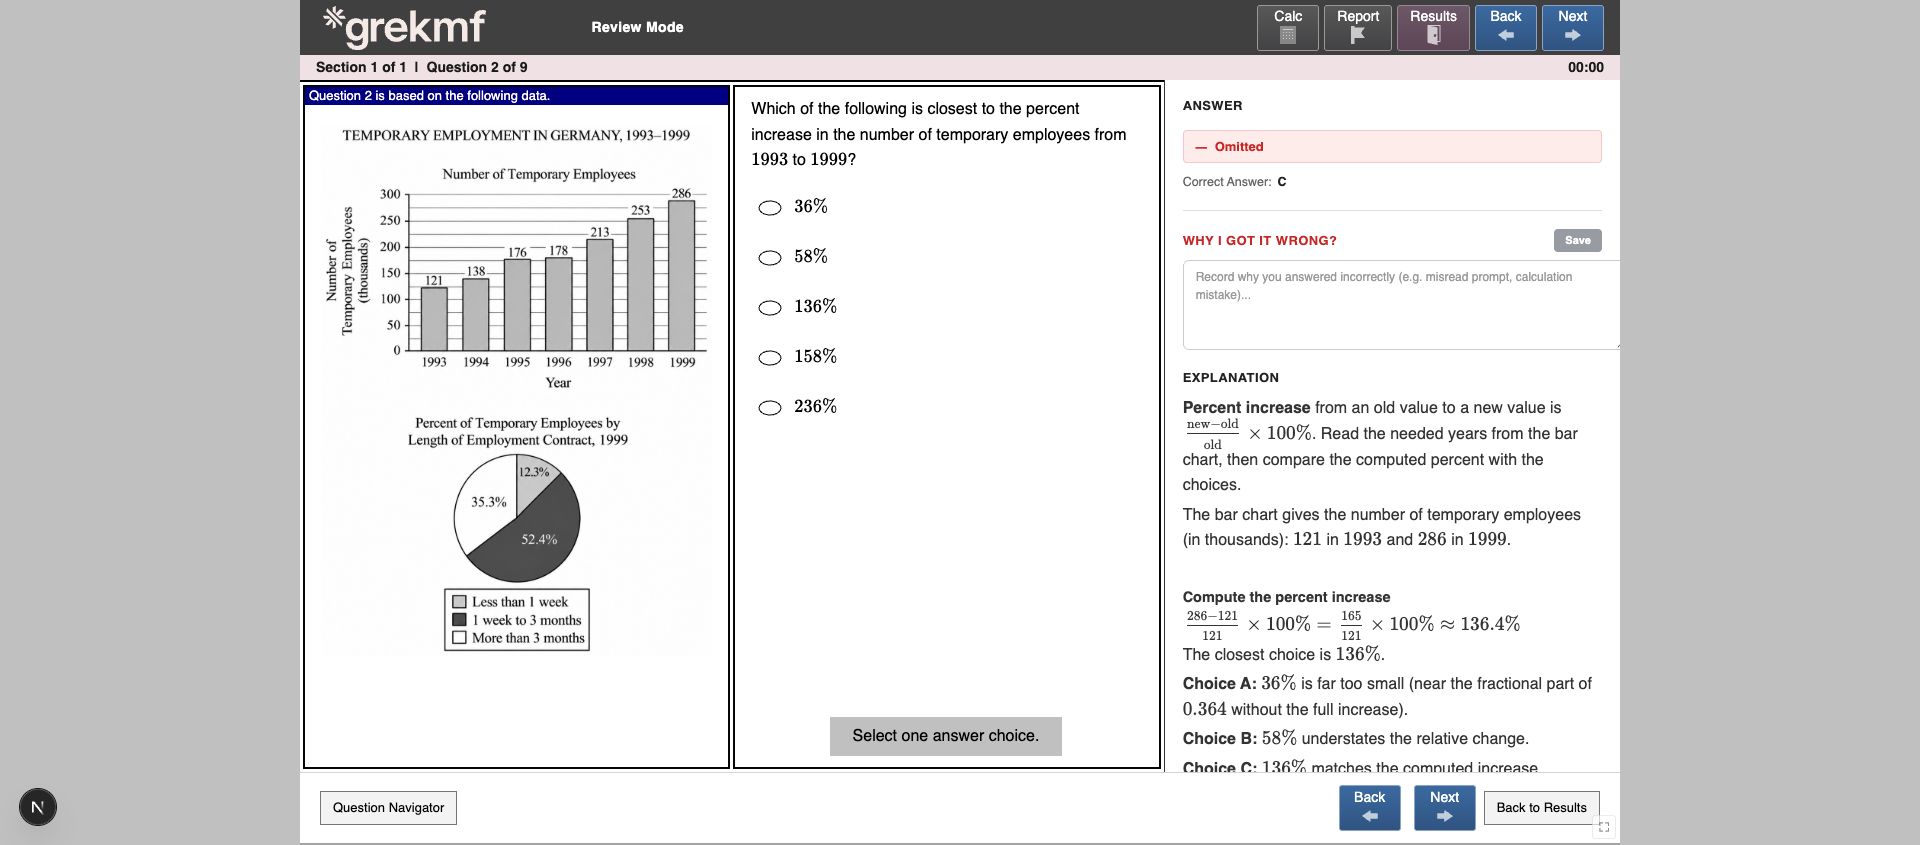
Percent increase from an old value to a new value is $\frac{\text{new} - \text{old}}{\text{old}} \times 100\%$. Read the needed years from the bar chart, then compare the computed percent with the choices.
The bar chart gives the number of temporary employees (in thousands): $121$ in $1993$ and $286$ in $1999$.
Compute the percent increase
$\frac{286 - 121}{121} \times 100\% = \frac{165}{121} \times 100\% \approx 136.4\%$
The closest choice is $136\%$.
Choice A: $36\%$ is far too small (near the fractional part of $0.364$ without the full increase).
Choice B: $58\%$ understates the relative change.
Choice C: $136\%$ matches the computed increase.
Choice D: $158\%$ confuses percent increase with a related but larger ratio.
Choice E: $236\%$ is roughly $\frac{286}{121}$ as a percent, which is the new value as a percent of the old value, not the increase.
Things to Remember:
- Percent increase $= \frac{\text{new} - \text{old}}{\text{old}} \times 100\%$.
- Do not confuse "new as a percent of old" with percent increase.
- When choices are rounded, compute exactly first, then pick the nearest option.
Put the method into practice
Practice in GREKMF’s exam-like question bank
Move from the guide to a focused set, then review detailed explanations and skill-level performance. The KMF 1000 Quant series is free and requires no card.
Start free GRE practiceFrequently asked questions
Often two or more questions share one display, so learn the chart once but solve each prompt independently.
Use it for awkward arithmetic, but write the correct relationship first and estimate before entering numbers.
Be comfortable with mean, median, mode, range, quartiles, standard deviation conceptually, and basic probability.